
Menu:
Office Hours M 10:20-11:20, W 11:30-12:20, Th 10-11, F 1:30-2:20 in
202
TAs: Sunday 9-11pm in 217, Wednesday 7-10pm in 217, Thursday 8-9pm in 221 (just for us)
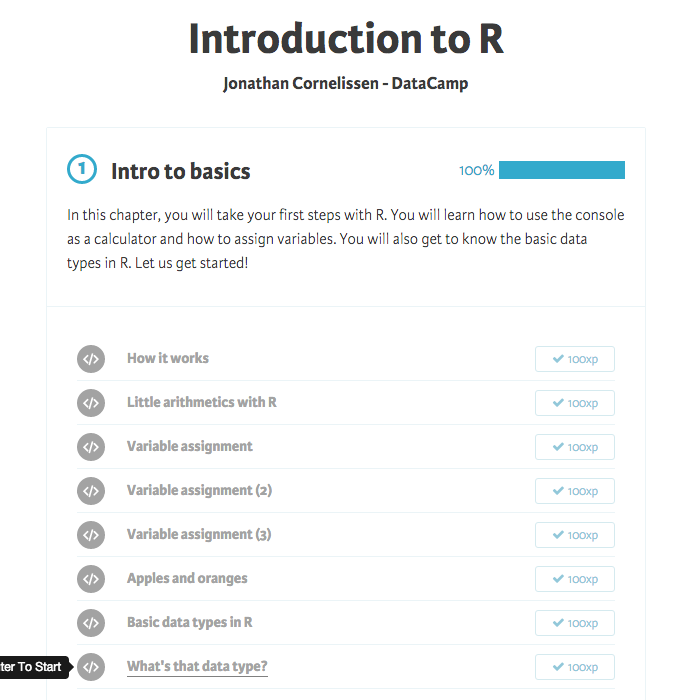
DataCamp Course in R used in Math 242 - please complete this ASAP
Recommended short course on Summarizing data in R.
Course resources can be found at remote.denison.edu
Link to our Math 242: Applied Statistics course from Fall 2015.
Applets from Rossman, Applets from Statlab, Applets from Online Stat Book
StatKey tool for visualization, computation, and randomization-based methods
R Resources: R for Windows, R for Mac, Quick-R, and R Reference Card. R FAQ, Wikibook, R-bloggers, Online R book, and list of free books. CodeSchool, Coursera, DataCamp, Tons of Examples for advanced modeling.
Resources for learning SQL: SQLzoo, SQLcourse, SQLtutor
Online Calculator for areas under statistical distribution curves
SPSS Video Tutorials for many advanced topics.
Recommended Exercises:
Regression in R: 1 and 2
Inference in R: 1 and 2
Chapter 0: 6, 8, 14, 17-19.
Chapter 1: 2-5, 8-9, 11-15, 21-22, 26, 30-31.
Chapter 2: 1-15, 28-29, 40-41.
Chapter 3: 1-2, 4, 6-7, 9, 12-14, 18, 20, 23-25, 27, 31-32.
Chapter 4: 1-4, 8, 9, 11, 14, 16-23.
Chapter 5: 4, 7-9, 11-16, 19-21, 22 (unstacked data), 28-29, 34-35.
Chapter 6: 3, 11-13, 19, 21-25, 29-31, 33-34.
Chapter 7: 1-5, 8-9, 11-12, 14-15, 17-19, 20-22, 27-31, 35-37, 39, 41.
Chapter 8: 1-3, 6, 9-11, 14-16, 18-19, 21-22, 26-32.
Chapter 9: 4, 5, 12, 15. 6-8, 11, 13-14, 17, 22, 25, 31.
Chapter 10: 2-8, 11, 15, 17, 21, 23, 27.
Chapter 11: 1, 3-7, 9, 11, 13-15, 18-19, 22-23, 29.
Future Videos:
Fixing Autocorrelation
Watch: R4.8 on relative risk
Bayes Theorem and False Positives
Data Management
Watch : TED on Big Data
Reliability - what to do if your data is not accurate, e.g. due to instruments used.
Measuring Reliability - when one individual is given the same test twice, calculate correlation between those measurements. If it's reliable, then the correlation should be very high.
PCA in Excel
Optional: download RevoScaleR for Big Data, do DataCamp RevoScaleR for Big Data
Free Data Mining Textbook
Parallel Programming in R
Bayesian in R, plus Blog about Bayesian stats
Excel VBA tutorial, reference, videos, online course...useful for many jobs.
Project Ideas:
Compare the various tests of normality, e.g. Shapiro-Wilk, Kolmogorov-Smirnov, D'Agostino, Lillefors
Compare all the ways of testing if variances are not equal.
Correlations for non-parametric and skewed regressions
Data Munging
Summarize how lasso and ridge regression work (via linear algebra), and implement them in R.
Learn the basics of Bayesian Statistics, and implement Gibbs Sampler in R.
Data Sets
https://archive.ics.uci.edu/ml/index.html
http://libguides.denison.edu/ECON407F2015
http://www.kdnuggets.com/datasets/index.html
http://www.datasciencecentral.com/m/blogpost?id=6448529%3ABlogPost%3A307383
Econ Dataset list
Zantran search engine for data
TAs: Sunday 9-11pm in 217, Wednesday 7-10pm in 217, Thursday 8-9pm in 221 (just for us)
DataCamp Course in R used in Math 242 - please complete this ASAP
Recommended short course on Summarizing data in R.
Course resources can be found at remote.denison.edu
Link to our Math 242: Applied Statistics course from Fall 2015.
Applets from Rossman, Applets from Statlab, Applets from Online Stat Book
StatKey tool for visualization, computation, and randomization-based methods
R Resources: R for Windows, R for Mac, Quick-R, and R Reference Card. R FAQ, Wikibook, R-bloggers, Online R book, and list of free books. CodeSchool, Coursera, DataCamp, Tons of Examples for advanced modeling.
Resources for learning SQL: SQLzoo, SQLcourse, SQLtutor
Online Calculator for areas under statistical distribution curves
SPSS Video Tutorials for many advanced topics.
| Day | Date | Topic +More Info |
Reading Due | Watch | R Practice Due | Work Due | |
| 1 | M | Jan 18 | Course Overview Randomization- Based Inference |
Visualization
Example |
Get the textbook! |
||
| W | Jan 20 | C.F.A.U. 2-Sample t-test 2-Sample CI Bootstrap CI |
Syllabus, Chapter 0, Why learn R |
Watch:
Why Randomization Watch: Bootstrapping |
R
as a Calculator (email me screenshot) |
||
| Th | Jan 21 | Lab1: Salary Discrimination. Demo on Schistosomiasis |
Forbes
on R, Start R, Lab1, Lab Guidelines |
Watch:
Intro Randomization Watch: R1.0. Watch: R3.4. |
Intro
to R (screenshot) Sample Screenshot |
Install
R & RStudio |
|
| F | Jan 22 | CI
for Corr, Discrimination Example, Best Jobs |
1.1-1.3 DataRev |
Watch:
Two-SampleT Watch: R1.3 Watch: R4.1 |
Student's
t-test in R (screenshot) |
||
| 2 | M | Jan 25 | No Class DS Jobs |
This Is Stats DS Monster |
Khan:
Regr review |
||
| W | Jan 27 | MLE, Example OLS formula DS Kaggle |
2.1-2.2, 4.5-4.6 |
Watch:
R1.4 Watch: R4.2 Watch: R1.5 |
Data in R (screenshot) | ||
| Th | Jan 28 | Chi-Square
Dist F Distribution Lab2: Sleep Deprivation |
Read Lab2, Randomization handouts |
Watch:R1.10 StatKey 2T Watch: tests |
Data
Frames (screenshot) |
||
| F | Jan 29 | Transformations Non-Parametric Correlation Prediction &CIs |
1.4, Ross Reading |
Watch:
R4.9 Watch: Q-Q |
Correlation - just unit 1 (screenshot) |
Lab1 | |
| 3 | M | Feb 1 | Outliers Influential Pts Leverage, Plots |
1.5, 4.3 |
Watch:
R2.6 Outliers Watch: R5.2 |
Scatterplot (hand in) Data in Ruby |
|
| W | Feb 3 | Correlation
is not Causation Sx formula Spurious Cor |
2.3-2.4 |
Watch:
R1.2 Watch: R2.8 |
Vectors
in R (screenshot) |
||
| Th | Feb 4 | Lab3: Tukey Bulging Rule |
Lab3 Tukey in R |
Watch: R1.8 Watch: Odds |
Lists
in R (screenshot) |
||
| F | Feb 5 | Logistic Model BoxCox |
9.1 | Watch: R1.6 |
Matrices (screenshot) |
Lab2 |
|
| 4 | M | Feb 8 | Quiz 1 |
1.6, 2.5, 11.1 |
Watch: TED Visualization | Writing Functions in R (hand in) | Quiz 1 |
| W | Feb 10 | Logistic Regression |
9.2 |
Watch: R1.7, conditionals | Graphing functions in R (hand in) | ||
| Th | Feb 11 | Lab4 Logistic: Bankruptcy, Flies, Pima tribe |
9.3 | Watch: Odds Watch: R5.4 |
Conditionals in R (screenshot) | ||
| F | Feb 12 | Logistic Inference |
9.4-9.5 11.3 |
Watch (both) |
|
Lab3 |
|
| 5 | M | Feb 15 | Multiple Linear Regression |
3.1-3.2 |
Watch (th'y) Watch: tutorial |
|
|
| W | Feb 17 | Interaction Normal cond Dummy Vars |
3.3, 4.4 |
Watch: R5.3 Watch: R5.5 |
Graphing 2 vars in R (hand in) |
||
| Th | Feb 18 |
Quiz on Ch9, Lab5: Military Spending, Visualization |
Application:
MultReg for food safety |
Watch: R5.7 Watch: R5.8 Watch: R5.9 |
MS=Military Spending (hand in) Tool for MS |
Quiz on Ch9 | |
| F | Feb 19 | Polynomial Reg Interaction Multicollinearity |
3.4-3.5, 4.1 |
Watch: Non- linear models |
|
Lab4 Mid Proposal |
|
| 6 | M | Feb 22 | Stepwise Backward Elim Cross Validation AIC, BIC |
3.6, 4.2 |
Watch: vars Watch: write |
Multiple
Linear Regression (screenshot) |
|
| W | Feb 24 | Linear Algebra Best Subsets |
Handout H2 |
GLM Logic |
Linear
Algebra in R (hand in) |
||
| Th | Feb 25 | Lab6: Develop
Econ,Worldbank |
3.7-3.8 |
Watch: R2.9 Watch: R2.10 |
|
Quiz on A |
|
| F | Feb 26 | Mult Logistic Split or Steal |
10.1-10.2 |
Example | Lab5 |
||
| 7 | M | Feb 29 | Goodness/Fit Test for indep Chi-Sq Tests |
10.3, 11.4, handout (ch7) |
Khan:
chi-sq Goodness/Fit Chi-Sq:Indep |
Rand Based p test (hand in) |
|
| W | Mar 2 | MultNomReg Poisson Reg QuasiPoisson Neg Binom Reg |
10.4, Read: Most Findings are False | Watch: R4.7 Chi-Sq Assoc Chi-Sq in R R3.2:Poisson |
Nonlinear
curves in R (hand in) |
||
| Th | Mar 3 | Visit from Larry Sherman |
10.5, Read: How to Write a Stats Paper |
TED:
stats & justice system Poisson Reg |
|
||
| F | Mar 4 | Concordance Overdispersion Fixing Overdisp. |
11.2 Handout |
Pois & NB Reg (till 6:00) NegBinReg |
Lab6 |
||
| 8 | M | Mar 7 | Quiz on Unit C |
10.6 |
Watch:Advice on writing & presentations |
|
|
| W | Mar 9 | Review Day | On p-values ASA p-values |
Excel Pivot Tables &why |
|
Project v1 |
|
| Th | Mar 10 | Midterm,
7-9pm in Olin 217 |
vlookup | ||||
| F | Mar 11 | On Fisher, Applications & Stats Edu. |
VBA & editor & coding | Mid-Semester Project Due | |||
| 9 | M | Mar 14 | Spring break |
||||
| W | Mar 16 | Spring break | |||||
| Th | Mar 17 | Spring break | |||||
| F | Mar 18 | Spring break | |||||
| 10 | M | Mar 21 | ANOVA Calc ANOVA Info |
5.1, 5.2 |
Watch:Cat.dta Khan: SST |
|
|
| W | Mar 23 | ANOVA Calc CI for Var Diff in Var |
5.3, 7.1 |
Khan:
SS's Khan: ANOVA F-test |
Factors
in R (screenshot) |
||
| Th | Mar 24 | Bonferroni Scheffe Tukey, q-table |
Lab7: ANOVA Sales Data 5.4, 7.2 |
Watch: R4.6 ANOVA Post Hoc Tests |
ANOVA
in R (screenshot) |
||
| F | Mar 25 | Design Randomization F |
8.1-8.2, 7.3 | Effect Size ANOVA |
|
||
| 11 | M | Mar 28 | 2-Way Calc |
6.1 | Watch: 2Way | DataTable package | |
| W | Mar 30 |
ANOVA with interactions |
6.2-6.3 | Watch: R5.10 interaction |
comparing
models |
||
| Th | Mar 31 | Within
ANOVA Factorial Design Large Samples |
6.4, Lab8: Network Analysis |
Moderation Factorial ANOVA |
|||
| F | Apr 1 | ANOVA for Proportions Fisher's Exact F Effect Sizes |
8.3-8.4 |
Watch:Chi-Sq Homogeneity Chi Post Hoc ANOVADesign |
|
Lab7 |
|
| 12 | M | Apr 4 | Nonparametric Effect Size Calc |
7.4, Median Handout, Effect Sizes | Video:
Risk Video: GLM Wilcoxon |
Data
Table Manip. in R (screenshot) |
|
| W | Apr 6 | Dummy Vars, ANCOVA, MANOVA, MANCOVA |
7.5-7.6 |
ANOVA GLM MANOVA (12:00 on) |
Repeated Measures ANOVA (screenshot) | ||
| Th | Apr 7 | Lab9: Multiple Comparison Simulation |
5.5, 6.5, 8.5 |
|
Quiz on B |
||
| F | Apr 8 | Method of Moments |
Handout |
Generalized Linear Model | |
Lab8 |
|
| 13 | M | Apr 11 | Generalized Lambda Distribution |
Curve
Fitting in R (hand in) |
|||
| W | Apr 13 | Generalized Beta |
HW on GLD |
||||
| Th | Apr 14 | Plotting Quantile Functions, EGLD |
Lab10: Mult Logistic, Sparrows |
Machine Learning |
|
||
| F | Apr 15 |
Multi-Level Modeling (MLM) |
Link R output |
|
Lab9, Final Project Proposals |
||
| 14 | M | Apr 18 |
PCA and Eigenvectors |
Local Reg PCA Packet |
PCA 3 vars, PCA uses |
Splines
in R (hand in) |
|
| W | Apr 20 | PCA and Biplots SVD applic. |
PCA Tutorial |
Dim. Reduct, Constructs, PCA in R |
|||
| Th | Apr 21 | Factor Analysis Lab11: PCA, Global Warming |
Factor Analysis |
Theory, SVD PCA via SVD SVD Example |
|||
| F | Apr 22 | Ridge/Lasso Regression, Lowess | Packets: 1, 2, 3 |
Lowess |
Lab10 |
||
| 15 | M | Apr 25 |
Time Series Gauss-Markov |
Packet (Wooldridge) |
FDL Model |
Quandl R (screenshot) |
|
| W | Apr 27 |
Time Series ARIMA |
Packet (ARIMA) |
ARIMA PACFs |
|||
| Th | Apr 28 | Presentations |
|||||
| F | Apr 29 | Presentations Evaluations |
Hockey Sticks |
Lab11 |
|||
| 16 | M | May 2 | Quiz on GLD, MLM, PCA, Time Series |
Final Project |
|||
| W | May 4 | Review Day |
|||||
| Th | May 5 | |
|||||
| F | May 6 |
|
|||||
| 17 | M | May 9 | Final Exam |
Regression in R: 1 and 2
Inference in R: 1 and 2
Chapter 0: 6, 8, 14, 17-19.
Chapter 1: 2-5, 8-9, 11-15, 21-22, 26, 30-31.
Chapter 2: 1-15, 28-29, 40-41.
Chapter 3: 1-2, 4, 6-7, 9, 12-14, 18, 20, 23-25, 27, 31-32.
Chapter 4: 1-4, 8, 9, 11, 14, 16-23.
Chapter 5: 4, 7-9, 11-16, 19-21, 22 (unstacked data), 28-29, 34-35.
Chapter 6: 3, 11-13, 19, 21-25, 29-31, 33-34.
Chapter 7: 1-5, 8-9, 11-12, 14-15, 17-19, 20-22, 27-31, 35-37, 39, 41.
Chapter 8: 1-3, 6, 9-11, 14-16, 18-19, 21-22, 26-32.
Chapter 9: 4, 5, 12, 15. 6-8, 11, 13-14, 17, 22, 25, 31.
Chapter 10: 2-8, 11, 15, 17, 21, 23, 27.
Chapter 11: 1, 3-7, 9, 11, 13-15, 18-19, 22-23, 29.
Future Videos:
Fixing Autocorrelation
Watch: R4.8 on relative risk
Bayes Theorem and False Positives
Data Management
Watch : TED on Big Data
Reliability - what to do if your data is not accurate, e.g. due to instruments used.
Measuring Reliability - when one individual is given the same test twice, calculate correlation between those measurements. If it's reliable, then the correlation should be very high.
PCA in Excel
Optional: download RevoScaleR for Big Data, do DataCamp RevoScaleR for Big Data
Free Data Mining Textbook
Parallel Programming in R
Bayesian in R, plus Blog about Bayesian stats
Excel VBA tutorial, reference, videos, online course...useful for many jobs.
Project Ideas:
Compare the various tests of normality, e.g. Shapiro-Wilk, Kolmogorov-Smirnov, D'Agostino, Lillefors
Compare all the ways of testing if variances are not equal.
Correlations for non-parametric and skewed regressions
Data Munging
Summarize how lasso and ridge regression work (via linear algebra), and implement them in R.
Learn the basics of Bayesian Statistics, and implement Gibbs Sampler in R.
Data Sets
https://archive.ics.uci.edu/ml/index.html
http://libguides.denison.edu/ECON407F2015
http://www.kdnuggets.com/datasets/index.html
http://www.datasciencecentral.com/m/blogpost?id=6448529%3ABlogPost%3A307383
Econ Dataset list
Zantran search engine for data