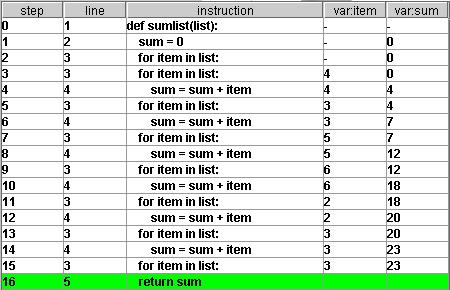
The debugger to the rescue! With the help of the debugger, you see how the variables in your program are changing at each step of its execution.
The Execution Table
The execution table is what you look at most when you are
working with the debugger, it shows each line of code that's been
executed, as well as the value of a number variables on the right of
the code, which represent the value of the variables after the
execution of the code.

The 'step' column shows the number of steps it has taken the
program from the first instruction to get to this point. The 'line'
column indicates the line number of the instruction in your .py file.
The 'instruction' column shows the text of the instruction. To the
right of the 'instruction' column, there are a number of columns each
with a name like 'var:some_var' where some_var can take on the name of
any variable you would like to watch.
How it works
Whenever the debugger is open, running a command in the
command window will cause the debugger to start running -- which means
the execution table will fill up with rows as instructions are ran in
the program. When the command finishes running, the rows remain there
in the execution table for you to take a look back (you can always
scroll up) at what has transpired.