Due: Friday, October 8th at class time
Write a program in a file Sequence.py that lists the squares of all integers from some start number down to one. Retrieve the start number from the user. For example, if you obtain the value of 6, the output of the program should be
   Squares from 36 down to 1:
   36, 25, 16, 9, 4, 1
Be sure to use the formatting given above, with a comma and a space after each number except for the final 1.
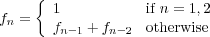
The Fibonacci numbers are a sequence of integers defined by the following recurrence relation
Thus the first six Fibonacci numbers are 1, 1, 2, 3, 5, 8. Create a program Fibonacci.py that prompts the user to enter a positive integer x > 2, and then prints the xth Fibonacci number. Thus a run of the program might appear as follows
   My incredible Fibonacci number generator!

   Please enter an integer: 8
   The 8th number in the Fibonacci sequence is 21.
A few suggestions:
In light of the recent economic meltdown, you've decided to take a more conservative approach with your financial portolio; as of today, you're getting rid of all your sub-prime morgage securities, all your toxic assets (what were you thinking?), and your considerable stockpile of pork bellies.
To play it safe, you're going to put your money into a savings account. This account earns a fixed percentage of interest every month. Assuming you make reguar, monthly deposits as well, you'd like to know how much you'll have after a given number of months.
Write a program in a file Interest.py that prompts the user to enter your initial deposit, the monthly interest rate, your monthly deposit, and the number of months you'd like computed. Then use a for-loop to compute and print your savings balance at the end of each month. Assume your monthly contribution occurs after interest is accrued.
For example, suppose your initial savings is $100, the monthly interest rate is 1%, and you plan on contributing $20 a month. Then during the first month, you'd get $1 of interest (100 * 0.01) followed by another $20 from your regular contribution. So you'd end the first month you'd have $121. On the second month, your interest would be $1.21 (121 * 0.01), which, together with you fixed $20, leaves you with $142.21, and so on. A run of your program might produce the following output
   Welcome to the Interest Calculator!

   Enter your initial savings: 100
   Enter the monthly interest rate: 0.01
   Enter your monthly contribution: 20
   How many months would you like computed: 3

   Initially you put in $100
   After month 1 you would have $121
   After month 2 you would have $142.21
   After month 3 you would have $163.63
In the next batch of problems, we're going to be looking for patterns in sequences of figures. For each problem, a few figures are given, each of which made out of ASCII characters and is associated with an index (a number). Your task is to first determine the pattern that dictates how a particular figure in the sequence relates to the corresponding number. Then you'll create a Python program that generates an arbitrary figure from the given sequence. All programs should have the user enter an integer, and then produce the corresponding figure. Your program that generates the Pattern A should be called PatternA.py, and so on.
For your first pattern program, consider the pattern shown below:
1 2 3
1 2 3
1 2 3
1 2 3 4
1 2 3 4
1 2 3 4
1 2 3 4
1 2 3 4 5
1 2 3 4 5
1 2 3 4 5
1 2 3 4 5
1 2 3 4 5
You can probably see what's happening; figure x consists of x rows, each of which includes all numbers from 1 to x. Therefore your program PatternA.py will need to first get an integer x from the user. Then you'll loop over rows from 1 to x. And for each row, you'll use a nested loop to print the digits from 1 to x, separated by spaces. Similarly, you should create PatternB.py and PatternC.py that generate arbitrary figures from the following two patterns.
    1 1 1
    2 2 2
    3 3 3
    1 1 1 1
    2 2 2 2
    3 3 3 3
    4 4 4 4
    1 1 1 1 1
    2 2 2 2 2
    3 3 3 3 3
    4 4 4 4 4
    5 5 5 5 5
    1 2 3
    2 3
    3
    1 2 3 4
    2 3 4
    3 4
    4
    1 2 3 4 5
    2 3 4 5
    3 4 5
    4 5
    5
    1
    1 2 2
    1 2 2 3 3 3
    1
    1 2 2
    1 2 2 3 3 3
    1 2 2 3 3 3 4 4 4 4
    1
    1 2 2
    1 2 2 3 3 3
    1 2 2 3 3 3 4 4 4 4
    1 2 2 3 3 3 4 4 4 4 5 5 5 5 5
    ***
    *
    **
    *
    ***
    ****
    *
    *
    ***
    *
    *
    ****
    *****
    *
    *
    *
    ****
    *
    *
    *
    *****
    *  *
    ** *
    * **
    *  *
    *   *
    **  *
    * * *
    *  **
    *   *
    *    *
    **   *
    * *  *
    *  * *
    *   **
    *    *
There are a number of methods (functions) associated with the GraphWin class that are used to interact with individual pixels (rather than drawing larger shapes). In particular, the method
plotPixel(x, y, Color)
sets the color of the pixel at coordinates (x,y) to have the color given by the string Color. Recall that you can create an appropriate color string by invoking the function:
color_rgb(red, green, blue)
where the parameters red, green, and blue are integers with values from 0 to 255 that specify the intensity of each of the color components.
Create a program called Shaded.py that creates an image which is 256 x 256 pixels large. Loop over all pixels in the image (nested loops will probably be needed here) and set their color according to the following scheme: set the red value of any given pixel to be the value of its x coordinate; set the blue value to be the value of its y coordinate; and set the green value to be 0. Then display the image. Remember, in an image that is x pixels wide, the index of the last column is x-1 (and similarly for the vertical indexing).